
Hotel CEO Pay For Performance Study
What a difference 6 months makes. 2020 began with hotel companies coming off one of the strongest years in history and feeling optimistic the good times would continue. Since then, the industry has had widespread closures, massive layoffs, and CEO’s taking significant pay cuts while grappling with a global pandemic. While we will explore the ramifications of this crisis in this article’s conclusion, much of this study is focused on 2019 compensation data.
What we have found over the twenty-plus years of studying CEO pay, that boards are still challenged with linking CEO pay to company performance. In fact, that was the goal of creating our pay-for-performance model. The Aethos™ Pay-for-Performance Model analyses key financial metrics such as market capitalization, stock appreciation, EBITDA growth, and total direct compensation over a three-year time horizon.
A positive move in pay mix continues as long-term incentives (LTIP) rose from 50% in 2018 to 53% in 2019 as a percentage of overall pay. In theory, by using Stock Options and RSUs as a greater percentage of a CEO’s compensation, it should align CEO behaviours with shareholder interests. Of course, the size and details of the overall pay package will impact this alignment as well.
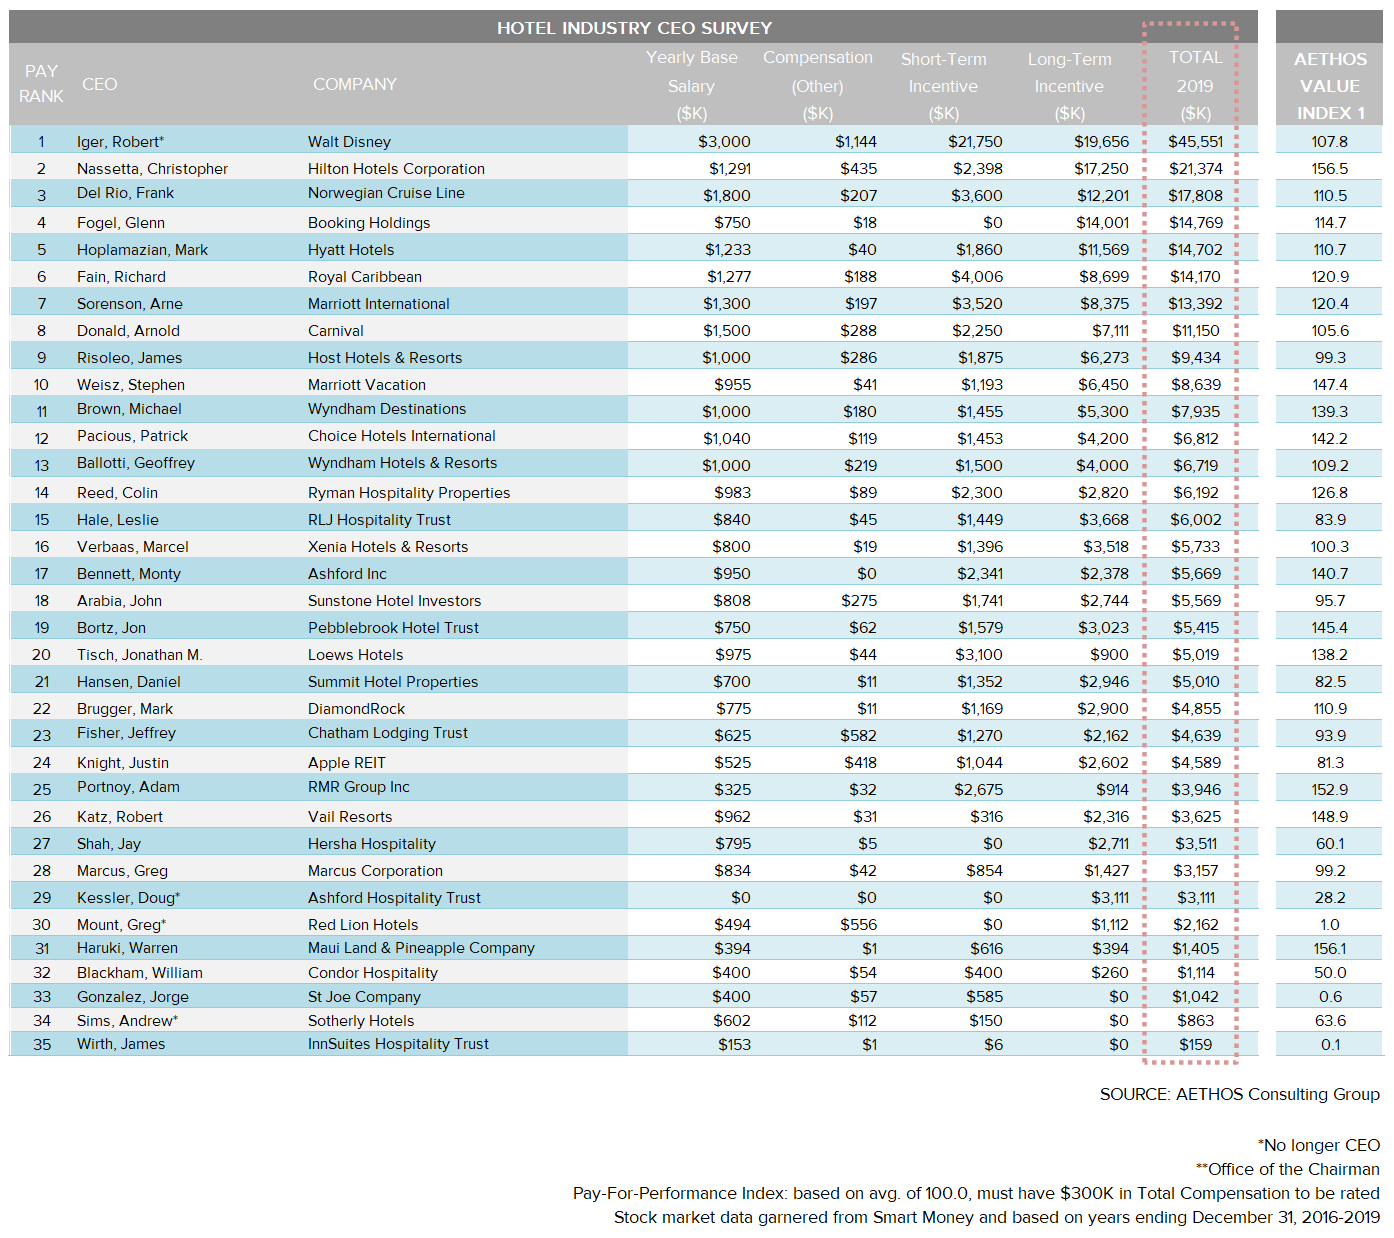
This year saw a new leader in our Aethos™ Value Index (AVI*) with Chris Nassetta of Hilton Hotels leading the field with an AVI of 156.5 – with 100 being the mean. Warren Haruki of Maui Land & Pineapple Company, Adam Portnoy of RMR Group, Robert Katz of Vail Resorts, and Stephen Weisz of Marriott Vacations rounding out the top 5 performing CEOs. Interestingly we found less deviation at the top of the list due primarily to the bottom performers being so poor. In fact, of the 35 Hotel CEOs, 21 had AVI scores above 100 and 28 had scores above 80.
Bob Iger, the recently departed CEO of Disney again topped the list in terms of 2019 total take home compensation, earning about $45 million – down from $65 million in 2018. In fact, Bob Iger finished tops in all three components of compensation earning $3 million in base salary, $21.75 million in short-term incentives, and $19.66 million in long-term incentives. Second place in all three categories belonged to Frank Del Rio of Norwegian Cruise Lines, Richard Fain of Royal Caribbean, and Chris Nassetta of Hilton, respectively. However, high total compensation does not necessarily mean a CEO was overpaid, or vice versa. In fact, 4 of the 5 top earners has AVIs above 80.
According to our AVI, Mr. Nassetta certainly earned his paycheck. Moreover, Hilton would have been the best stock investment over the past three years, nearly doubling from $55.81 to $110.91, in addition to a $.60 yearly dividend. Choice and Marriott rounded out the top 3 with stock appreciation of 85% and 83% respectively. Fiscal 2020 will be remembered as a year of sea change and significant pain. It will be interesting to see how CEO compensation will track against horrific financial performance. Maybe then we will see who really performed well in a crisis and who did not.
(*) The Aethos™ Value Index = (M + S + E ) / C
- Market Complexity Factor (M): The M Factor quantifies the complexity differential of running a large cap versus a small cap company. It is calculated by comparing the market capitalization of the subject company to the average market capitalization of the peer group.
- Stock Appreciation Factor (S): The S Factor measures stock appreciation. It is calculated by comparing the stock appreciation of the subject company to the average stock appreciation of the peer group over a given period of time.
- EBITDA Growth Factor (E): The E Factor measures EBITDA growth. It is calculated by comparing the EBITDA growth of the subject company to the average EBITDA growth of the peer group over a given period of time.
- Compensation Benchmark (C): The C Factor quantifies the degree to which a chief executive over or under earns his peer group. Compensation includes base salary, short-term incentives long-term incentives and other compensation as required by SEC regulations. Stock options are valued using the Black-Scholes valuation model. The C Factor is calculated by comparing the total compensation of the subject executive with the average total compensation of the peer group.